
Gold has been strong of late as the US Dollar has been weak. This combo has driven the Gold/Dollar ratio to a key price zone and momentum level, that looks to be important to metals bulls.
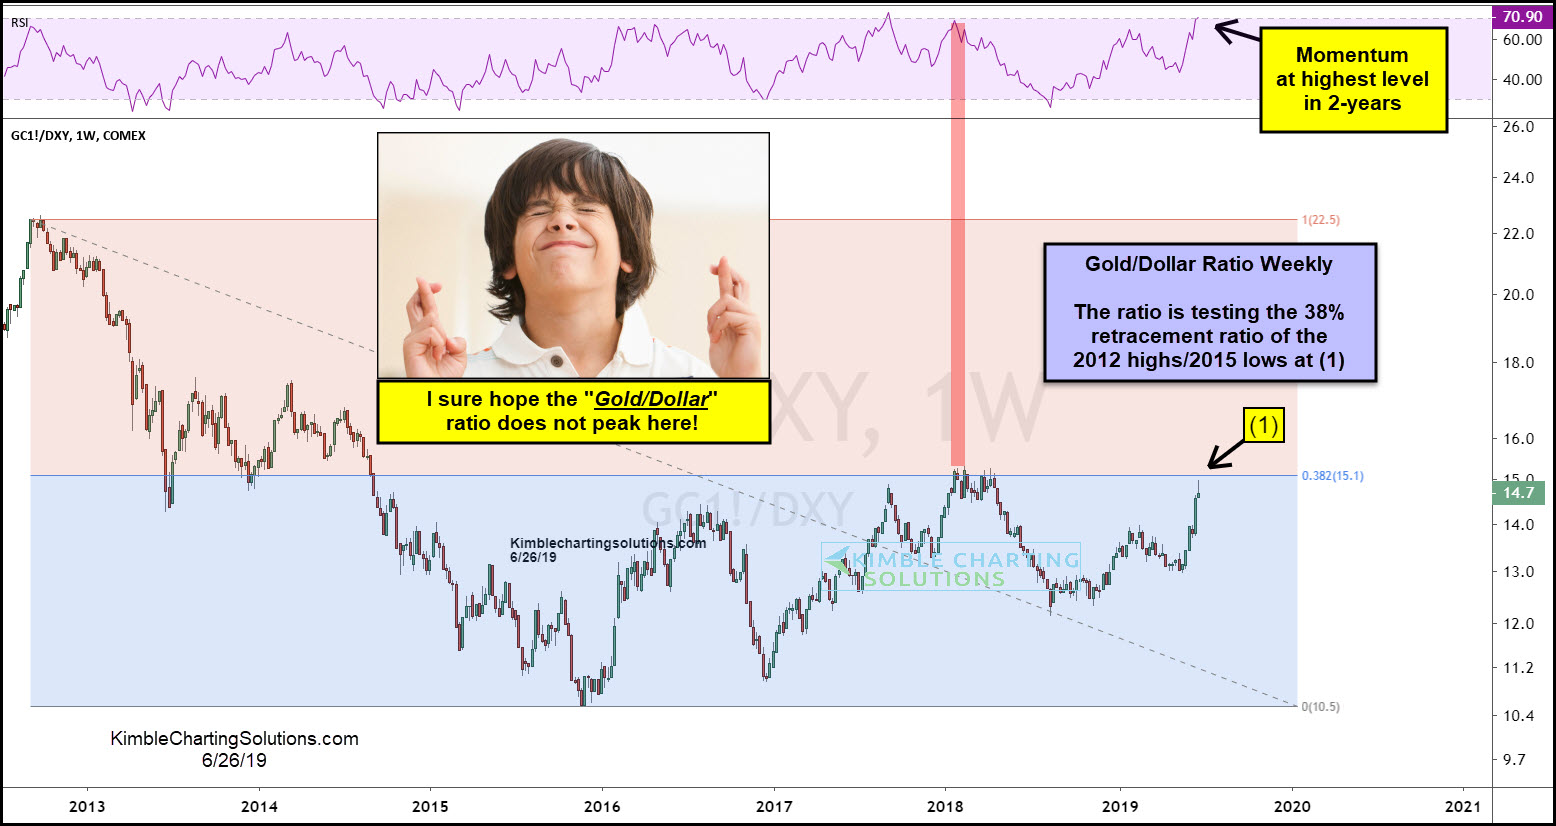
This chart looks at the Gold/Dollar ratio over the past 6-years. The long-term trend is down, while the trend over the past 3-years is pretty much flat (sideways trading range).
The rally of late has the ratio testing the 2018 highs as well as its 38% Fibonacci retracement level of the 2012 highs/2015 lows at (1).
While testing these key levels at (1), momentum is currently the highs since the 2017 highs. The bullish case for metals is facing an important breakout/resistance test at (1).
One thing is for sure, metals bulls have their fingers crossed that a lower high peak does not take place at current levels.
If the ratio breaks above resistance at (1), it would send a bullish message to metals they haven’t received in years!
–
